2 minutes
Log your Docker containers from a container with packetbeat
packetbeat is one of the best application performance management tools in the opensource community. It’s now part of the beats that Elastic provide us to monitor our applications. What it does is analyze our data packets to send some useful information to ElasticSearch.
After the introduction you probably realize that we will need: ElasticSearch installed and if you want to see something useful you will need Kibana as well. There is a guide for getting started that explains the process pretty clearly. The “problem” with that guide is that you need to install everything in your machine, this blog post is a 101 to have it quickly running into containers.
As mentioned, we will need ES and Kibana:
docker run -d -p 9200:9200 -p 9300:9300 --name elasticsearch-pb elasticsearch
docker run -d -p 5601:5601 --name kibana-pb --link elasticsearch-pb:elasticsearch \
  -e ELASTICSEARCH_URL=http://elasticsearch:9200 kibana
Now we have all the required things to run our packetbeat. There are few points that I want to raise before doing so:
- packetbeat will be monitoring our network traffic, this means that our container running packetbeat needs to have access to the host network.
- the last
DockerfileI found regarding this was: https://github.com/packetbeat/packetbeat-docker by Tudor (one of the original developers) but it is a little bit old. So I made my own based on that (should PR but I wonder why the previous was not updated yet, and it would be nice to run something more actual than 0.5 but there are no binaries):
The previous docker image will require a file packetbeat.yml to work after.
As a quick start you can use this one:
https://github.com/elastic/packetbeat/blob/master/packetbeat.dev.yml but
probably you would like to change your device from en0 to docker0.
docker build -t agonzalezro/packetbeat .
docker run --net=host agonzalezro/packetbeat
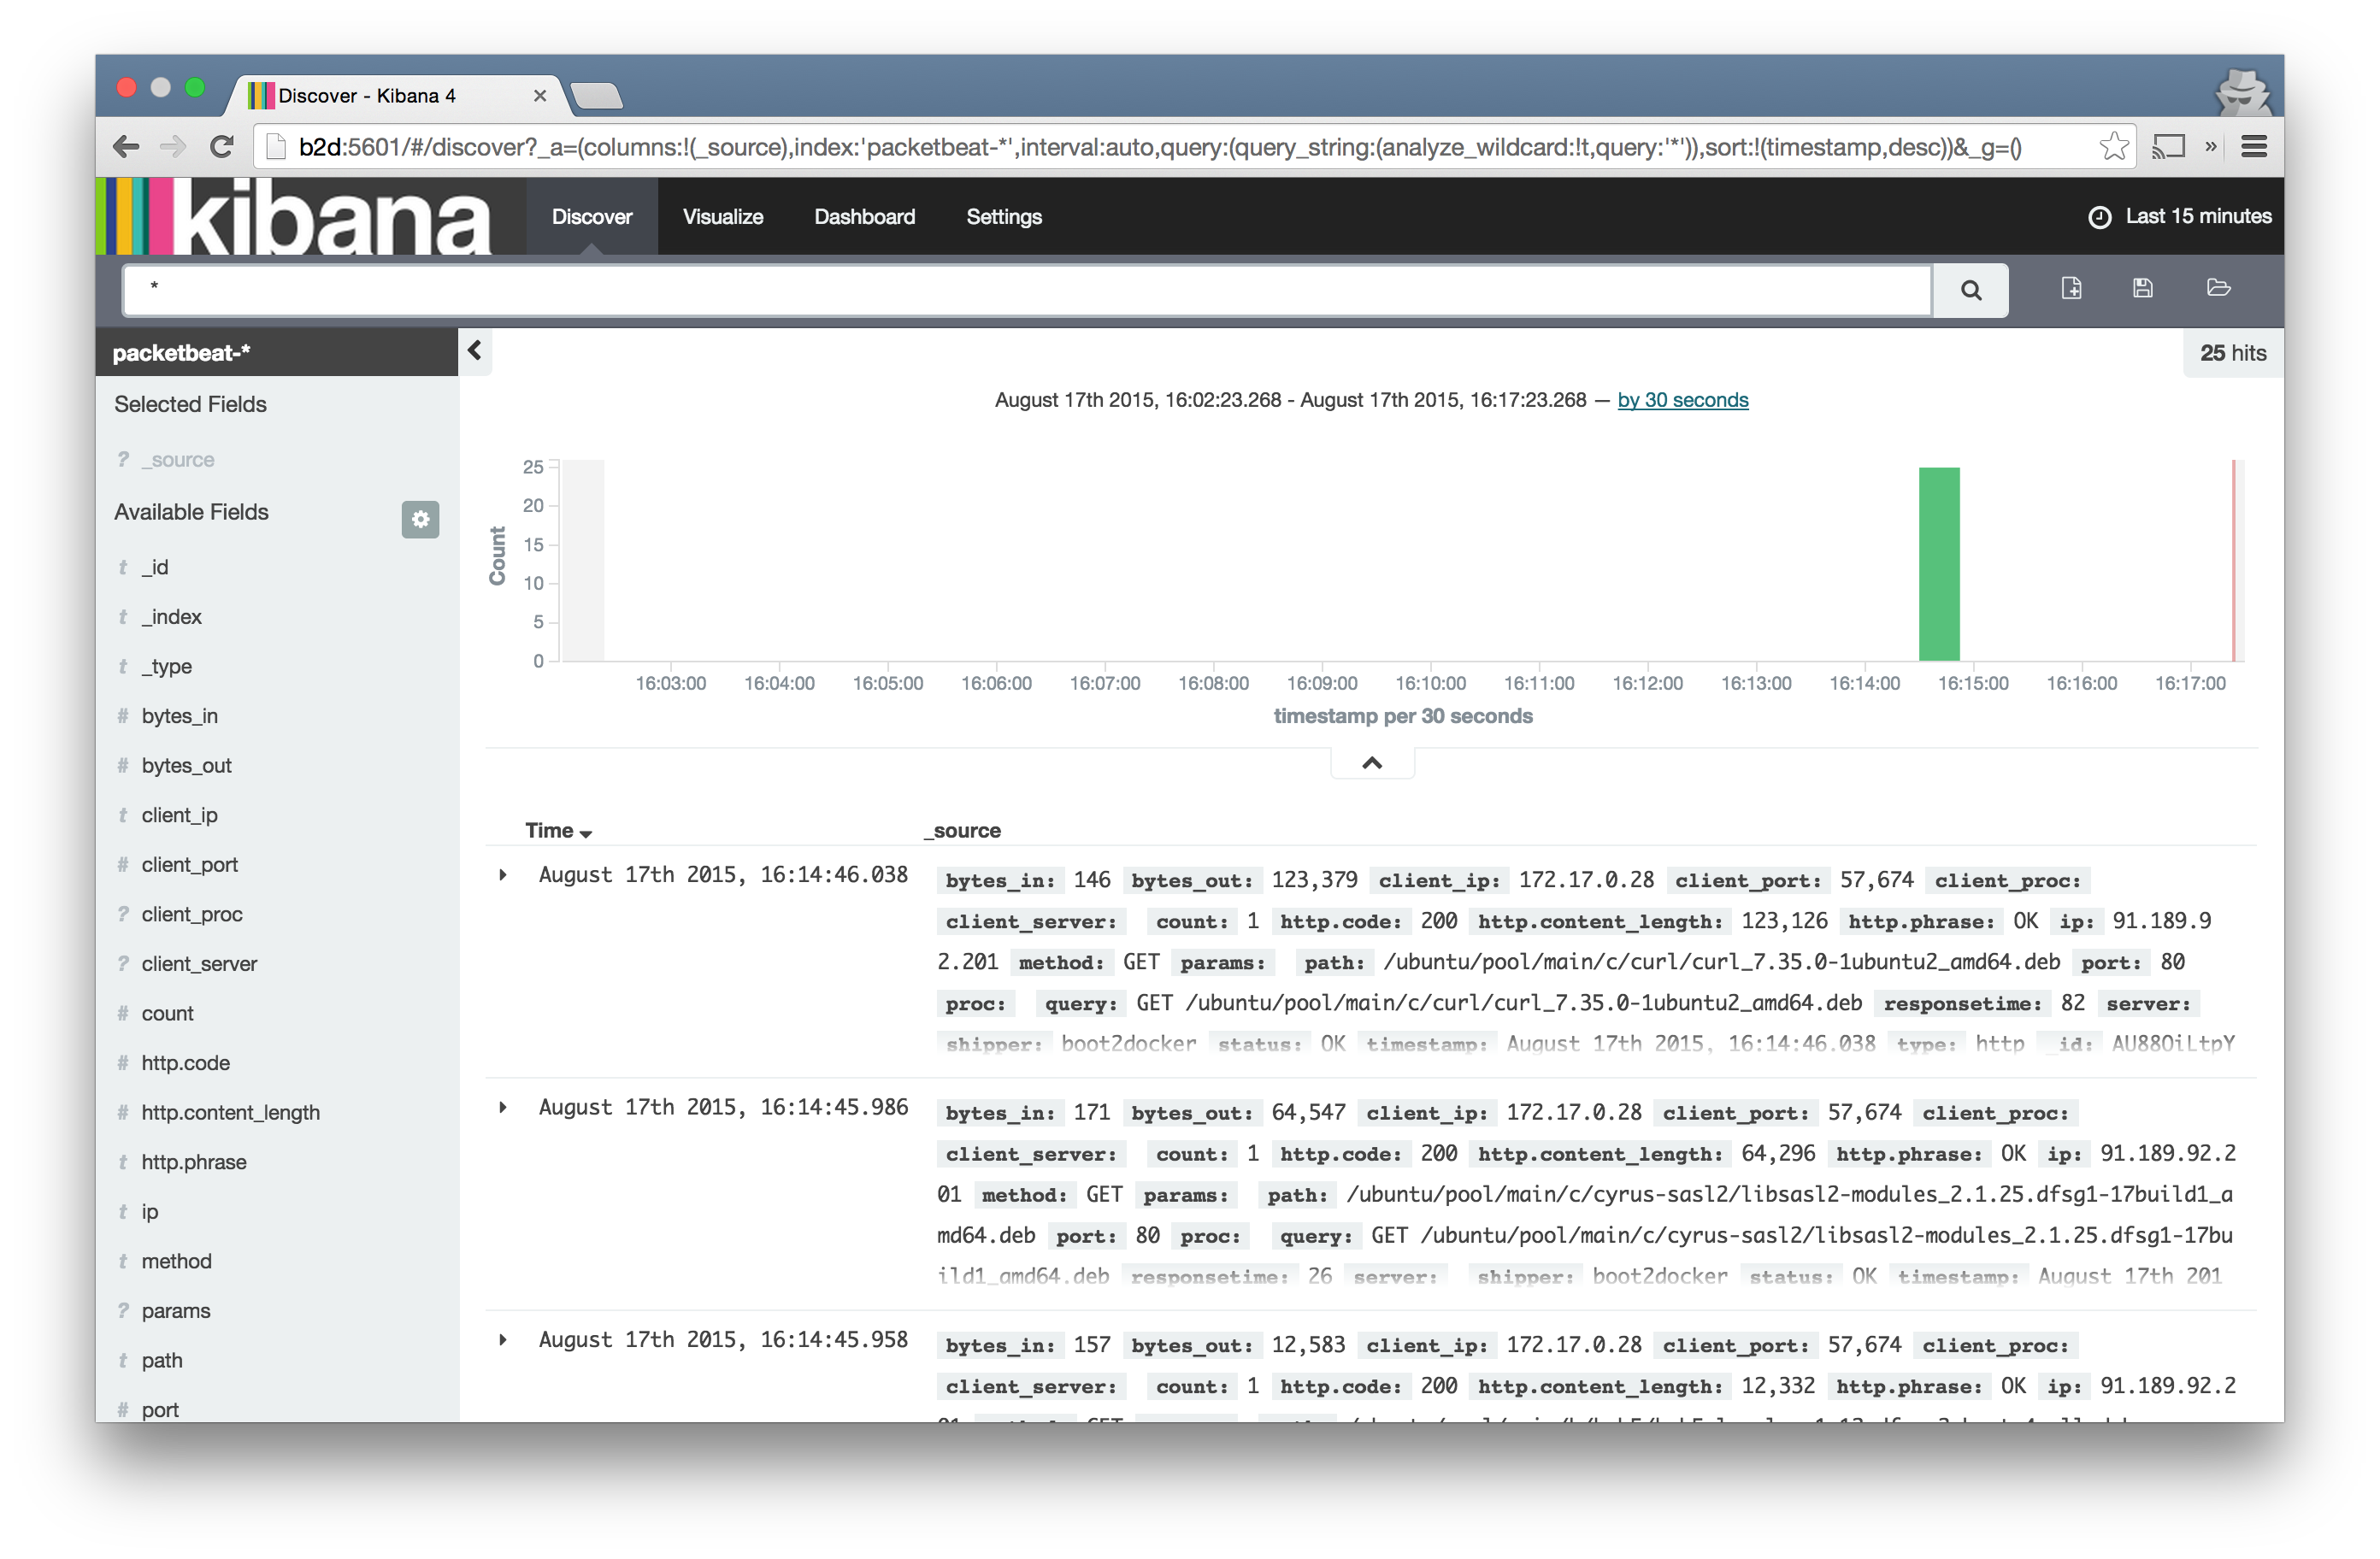
Cool, now you are ready to go! Everything that you do into your containers will
be show on Kibana, to test it go to you docker host port 5601, it will ask
for an index pattern, change the default logstash-* to packetbeat-* and
enjoy it!
If you have any comment, let me know here or in twitter. Also, if you are interested in monitoring with packetbeat you should definitely take a look to “Kamailio monitoring with statsd, SIPCapture or Packetbeat” by my friend eloycoto who introduced me to packetbeat :a)